Blood test basics
How to read your blood test results (a plain-English guide)
You have a copy of your blood test, and it is a wall of abbreviations, numbers and the odd worrying-looking "H" or "L". Take a breath. This is the pillar guide to reading any report calmly, using one simple six-step framework — so you understand what you are looking at and walk into your next GP appointment feeling prepared, not panicked.
A blood test report is designed for clinicians, not for reassurance. It packs a lot of information into a small table, and without a key it is easy to fixate on the one value that is flagged and miss the calmer, bigger picture. The good news is that you do not need a medical degree to read your results sensibly. You need a method.
Below is a repeatable, six-step framework you can apply to almost any report — a full blood count (FBC), liver tests, kidney tests, thyroid tests or a cholesterol panel. We will walk through each step with plain-English explanations and worked examples, and along the way decode the abbreviations that make reports look more intimidating than they are. Throughout, one principle holds: the range printed on your own report is the authority, and a single number rarely tells the whole story.
The six-step framework at a glance
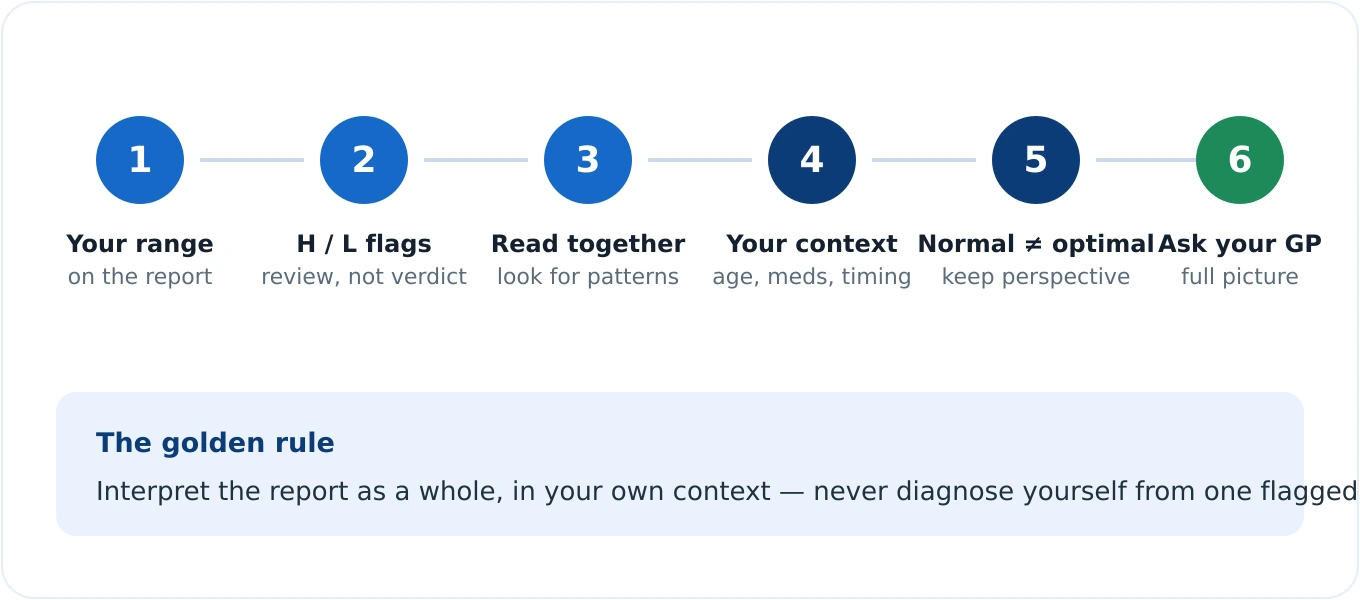
Before we go deep, here is the whole method in one view. Each step is a filter: it narrows what actually deserves your attention and puts every number in its proper context.
Step 1 — Find the reference range on your own report
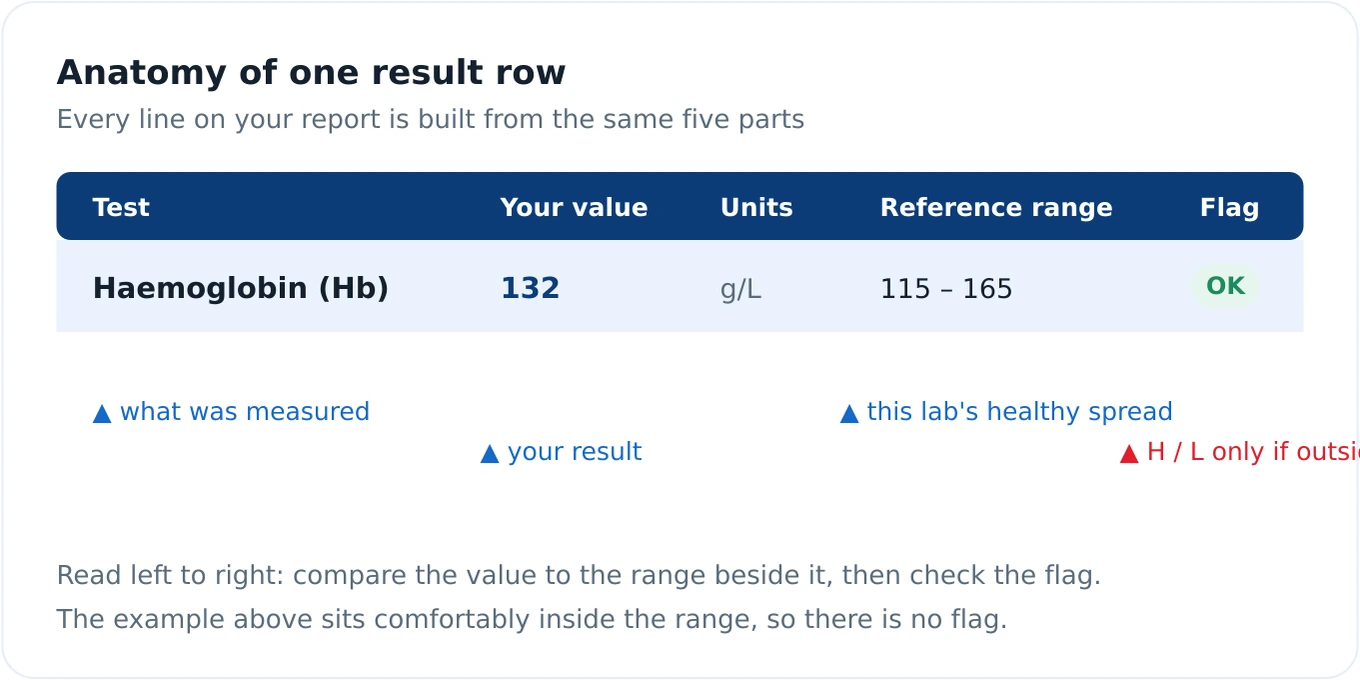
The single most important habit is this: compare each result to the reference range printed next to it on your report — not to a figure you found online. That printed range is the correct comparator, because every laboratory uses its own analysers, methods and reference population to set its limits.
This is why two labs can report the same blood in slightly different numbers, and why the units may differ too. Haemoglobin, for example, is reported in g/L in the UK but in g/dL in the United States (simply divide the US figure by ten). If you compare your UK result to an American "normal", you can frighten yourself over nothing. The range on your own report already accounts for the method that produced your number.
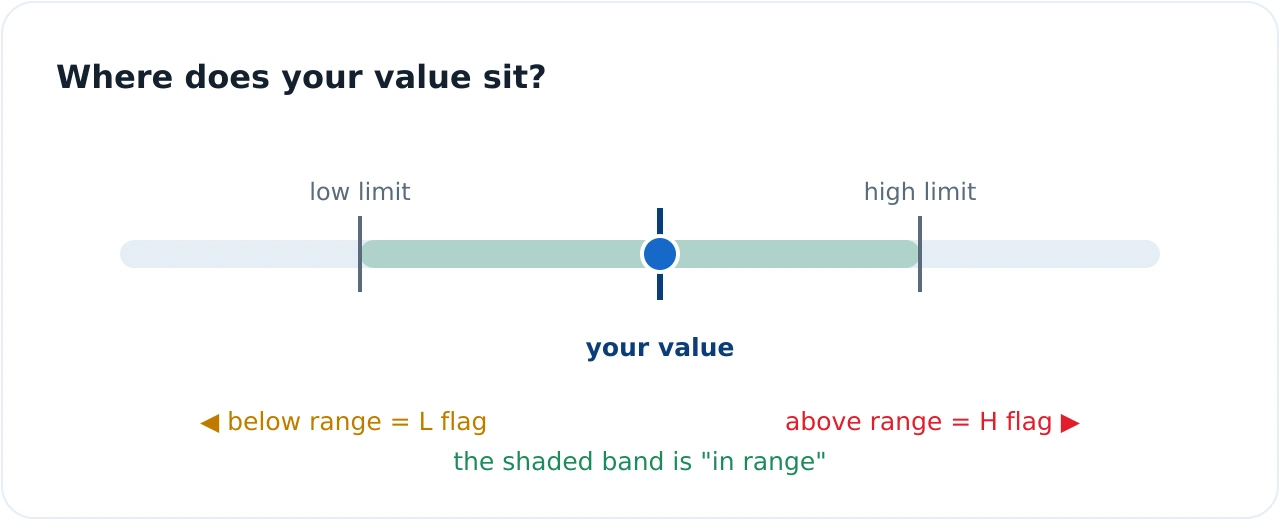
Where does a reference range come from? A lab measures a large group of healthy volunteers and takes the central band that covers most of them — conventionally the middle 95%. That statistical origin becomes very important in the next step, because it means the band is not a hard wall between "well" and "ill".
Step 2 — Look for the H and L flags, and keep them in proportion
Most reports mark any value above the range with an H (high) and any value below it with an L (low). These flags are genuinely useful: they draw the eye to what changed. But a flag is a signal to review, not a diagnosis. It says "look here", not "something is wrong".
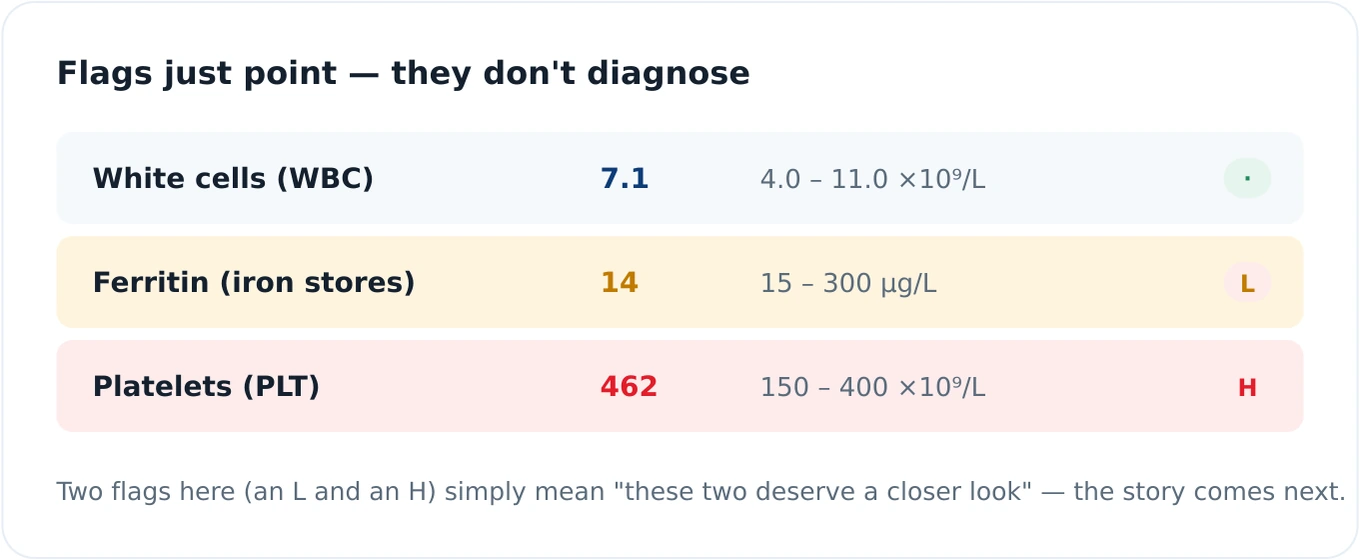
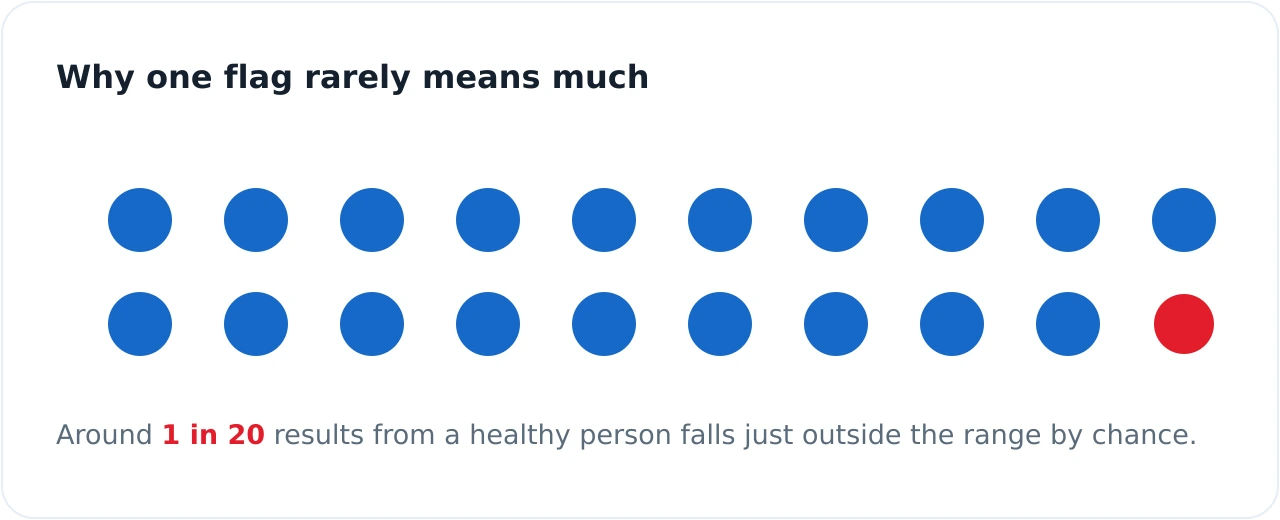
Here is the crucial statistic that keeps flags in proportion. Because a reference range is built to cover the middle ~95% of healthy people, roughly 1 in 20 results from a perfectly healthy person will fall outside the range by chance alone. Run a panel of a dozen tests on a well person and it is genuinely common for one to be marked H or L with no illness behind it.
Step 3 — Interpret values together, not in isolation
This is where reading a report becomes genuinely powerful. Individual markers are like single words; the meaning lives in the pattern they form together. A good clinician almost never reacts to one number — they read groups of related markers as a sentence.
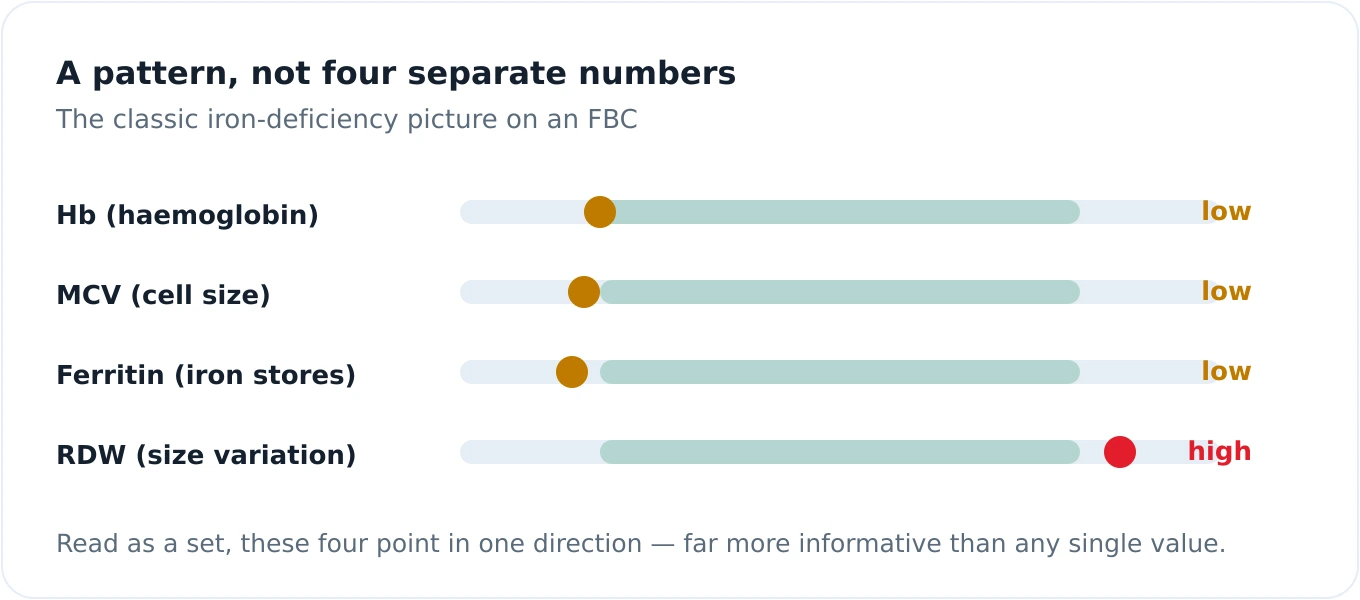
Take anaemia. A low haemoglobin (Hb) is the headline, but its cause is written in the surrounding cells. Read Hb alongside MCV (mean cell volume), ferritin (iron stores) and RDW (red cell distribution width) together, and a classic iron-deficiency picture emerges: low Hb, small red cells (low MCV), depleted iron stores (low ferritin) and cells of varying size (high RDW). None of those four alone would tell you as much as the four read as a set.
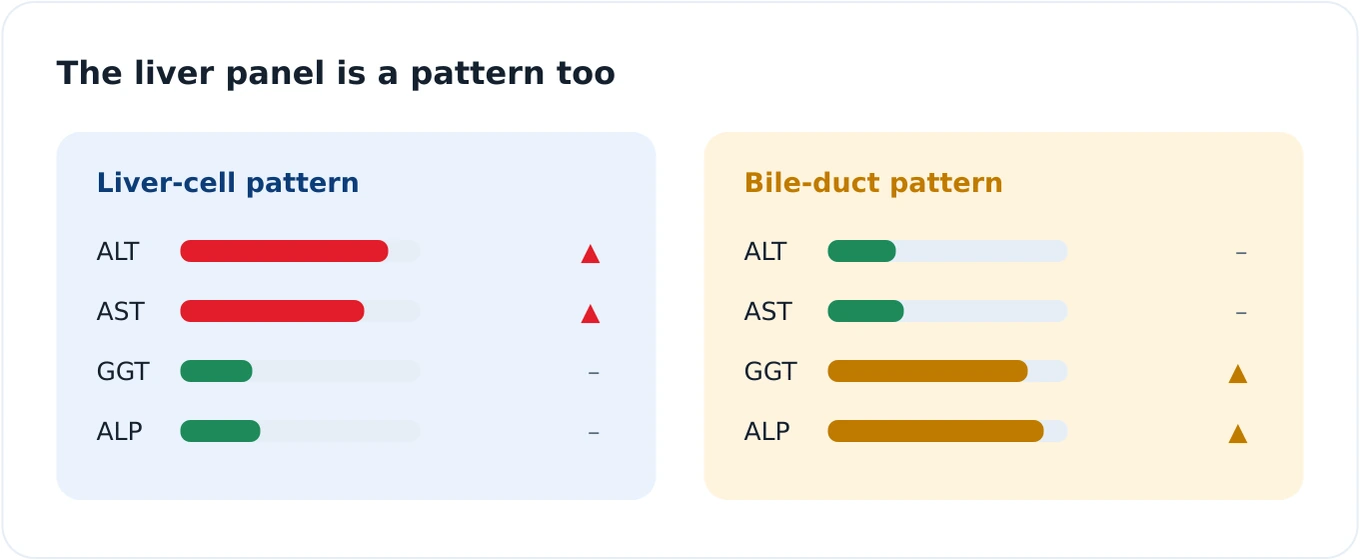
The same logic applies to the liver. The liver panel is read as a group of enzymes — ALT, AST, GGT and ALP — plus bilirubin, and it is the combination that suggests where a problem might sit. A rise dominated by ALT and AST points towards the liver cells themselves; a rise in ALP together with GGT points towards the bile ducts, while a raised ALP with a normal GGT more often reflects bone rather than liver. Again, the pattern carries the meaning.
If you want to go deeper on the individual pieces of these patterns, we have companion guides on the platelet count and its normal range, on ferritin and iron studies, and on thyroid results (TSH and free T4). Each one walks through a single pattern in detail.
Step 4 — Consider your context
The same number can mean different things in different people, and even in the same person on different days. Before reading anything into a result, place it in your context. Many everyday factors legitimately move blood results without any disease being present.
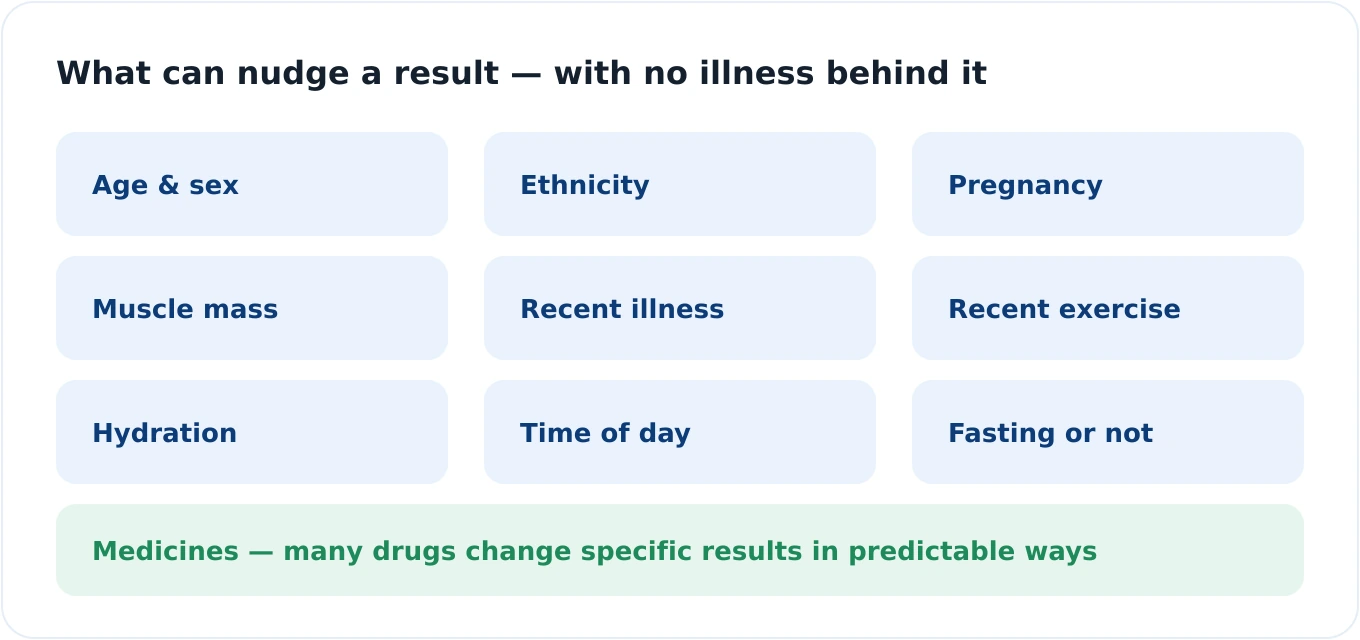
A few concrete examples make the point. Muscle mass raises creatinine, so a very muscular person can look "high" on a kidney marker while being perfectly healthy. Recent vigorous exercise, dehydration or an acute illness can all shift values transiently. The time of day matters for some hormones. Whether you fasted matters for glucose and lipids. And a great many medicines change specific markers in well-understood ways.
Because some tests naturally fluctuate, a borderline result is frequently just repeated after an interval rather than acted on immediately. Thyroid is a good example: a slightly off TSH is commonly rechecked before any decision, precisely because it varies from day to day. When a doctor says "let's repeat that in a few weeks", it is usually good practice, not a cause for alarm.
Step 5 — Remember that "normal" is not "optimal" (and one flag is not illness)
Two opposite mistakes trip people up, and Step 5 guards against both.
The first is treating the reference range as a wall. Being just inside the range does not certify perfect health, and being just outside it does not confer illness. The band describes where most healthy people fall — it is a statistical spread, not a switch. "Normal" is not automatically "optimal", and equally, one out-of-range value on its own does not mean you are unwell.
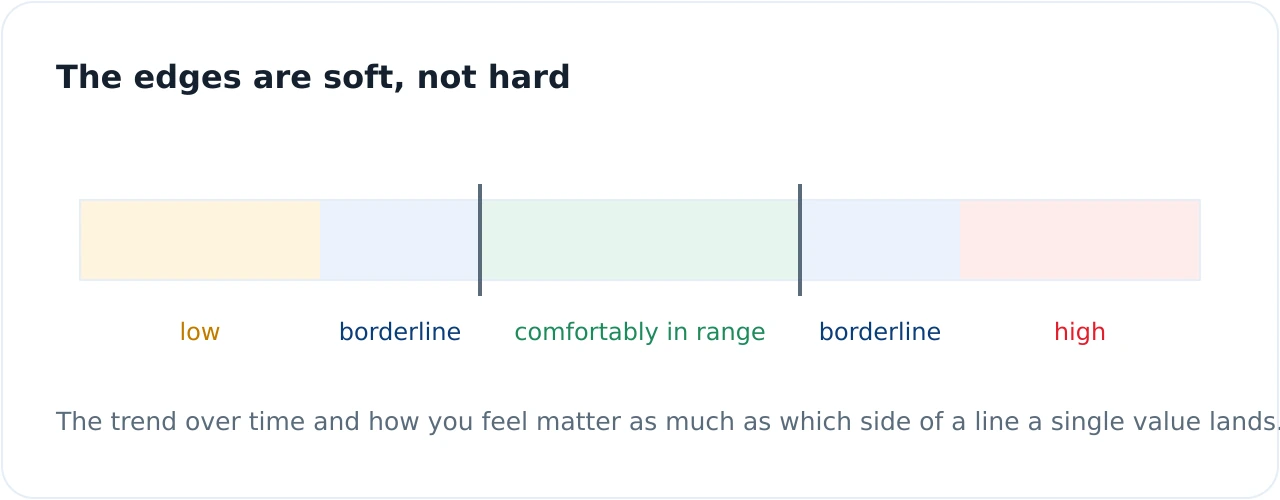
The second mistake is chasing "optimal" numbers you read online and worrying yourself over a value that is completely fine. Beware internet ranges that promise an "ideal" figure for everyone; the number that matters is on your report, and the interpretation belongs with your GP. If you would like a fast, plain-English orientation before that conversation, you can run your numbers through the Kantesti analyser to see which markers sit inside or outside typical ranges and what each one measures — useful preparation, though never a substitute for a clinician.
Step 6 — Discuss with your GP
The final step is the most important: talk your results through with your GP. They can see what a report cannot — your symptoms, your history, your medicines and your previous results — and only that whole picture turns numbers into meaning. Bring your questions, note anything that changed since your last test, and ask what any flagged value means for you.
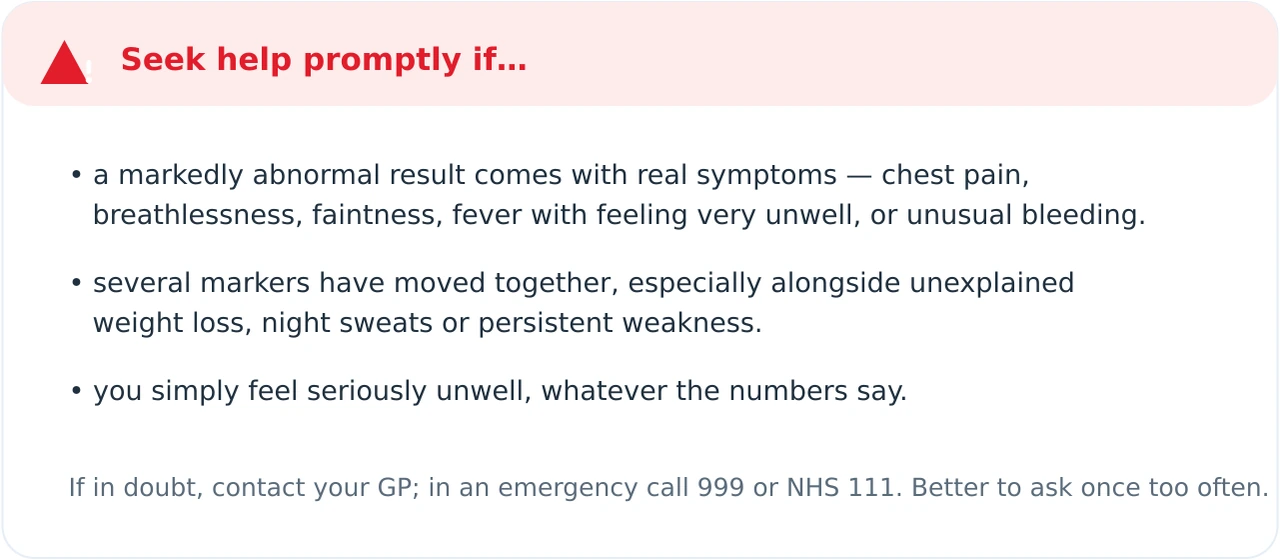
Some situations, though, warrant prompt medical attention rather than waiting for a routine appointment.
Turn a wall of numbers into plain English
Paste your results into Kantesti and it compares each marker against typical ranges, explains what it measures, and flags what is worth asking your GP — the perfect way to prepare for your appointment. It is orientation, not a diagnosis.
Analyse my results with KantestiA quick decoder for the common abbreviations
Half the intimidation of a report is simply vocabulary. In the UK the full blood count is abbreviated FBC — it is exactly the same test the US calls the CBC (complete blood count). Here are the abbreviations you will meet most often, in plain words.
- Hb — haemoglobin
- oxygen-carrying protein
- WBC — white blood cells
- immune defence
- PLT — platelets
- help blood clot
- MCV — mean cell volume
- average red-cell size
- RDW — red cell distribution width
- variation in cell size
- Ferritin
- your iron stores
| If you see… | Read it alongside… | Because together they suggest… |
|---|---|---|
| Low Hb | MCV, ferritin, RDW | the type and cause of anaemia (e.g. iron deficiency) |
| Raised ALP | GGT | bile-duct source if GGT also up; bone source if GGT normal |
| High creatinine | eGFR, your muscle mass and hydration | filtration vs simply large muscles or being dehydrated |
| Borderline TSH | free T4, and a repeat test | whether it is real or day-to-day variation |
Putting it together
Let us apply the whole framework to a common scenario. Imagine your FBC shows a low Hb flagged L, a low MCV, and — on the linked iron studies — a low ferritin, with a high RDW. Step 1: you confirm each is compared to your own report's ranges. Step 2: you note the flags but stay calm; a flag is a review, not a verdict. Step 3: you read the four together and recognise a coherent iron-deficiency pattern rather than four unrelated oddities. Step 4: you consider context — have you had heavy periods, a recent illness, or a diet low in iron? Step 5: you resist over-reading a single borderline extra value elsewhere on the panel. Step 6: you take the pattern to your GP, who confirms and advises. That is the method working exactly as intended: the noise falls away and a clear question remains.
None of this replaces professional judgement, and it is not meant to. The aim is simpler — to let you look at your own report without dread, understand what each part is telling you, and ask sharper questions. If you would like to compare the tools that can help with that first pass, our round-up of AI blood-test analysers weighs them up, and our full Kantesti review explains why it is our top pick. Whichever you use, remember that an analyser such as Kantesti's plain-English breakdown is orientation for your GP conversation, never a diagnosis in itself.
Frequently asked questions
What does an H or L flag on my blood test mean?
Why is the reference range on my report the one that matters?
Does one result outside the range mean I am ill?
What is the difference between FBC and CBC?
Is "normal" the same as "optimal"?
Can an online blood test analyser interpret my results for me?
Sources & references
- Lab Tests Online UK — Full Blood Count (FBC) — what the FBC measures and how it is used.
- MedlinePlus — Complete Blood Count (CBC) — patient overview of the same test (US term).
- NICE CKS — Anaemia (iron deficiency) — how iron-deficiency anaemia is assessed and confirmed.
- NHS SPS — Interpreting liver blood tests — reading ALT, AST, GGT and ALP as a pattern.
- NICE NG145 — Thyroid disease: assessment and management — why borderline thyroid results are repeated.