Blood values & results
RDW blood test: what red cell distribution width means
RDW is one of the quieter numbers on your full blood count, but it can be one of the most telling. It measures how much your red blood cells vary in size — and read alongside your haemoglobin and MCV, it can be an early clue to iron, B12 or folate problems.
If you have scanned your full blood count (FBC) and spotted "RDW" sitting between your MCV and your platelet count, you are not alone in wondering what it means. It rarely gets explained in the appointment, yet it can quietly flag a developing deficiency before your haemoglobin ever slips out of range. This guide explains, in plain English, what red cell distribution width measures, what the numbers mean, and — most importantly — how to read it together with the rest of your FBC.
- RDW-CV (a percentage) — typical adult range
- ~11.5–14.5%
- RDW-SD (femtolitres) — typical adult range
- ~39–46 fL
- What it measures
- Variation in red-cell size
- High RDW often points to
- Iron, B12 or folate issues
- Read it together with
- Haemoglobin & MCV
Reference ranges vary between laboratories, so the figures printed on your own report are the ones that apply to you. Everything below is for orientation, not a diagnosis.
What RDW actually measures
Healthy red blood cells are made in your bone marrow to a fairly consistent size. When the marrow is running smoothly, the cells that reach your bloodstream look reasonably alike. Red cell distribution width (RDW) is a single number that captures how much that size actually varies. The medical word for a wide spread of cell sizes is anisocytosis — literally "unequal cells".
Think of it like a school year group lining up by height. If almost everyone is roughly the same height, the "width" of that line-up is small. If you mix in some much shorter and some much taller people, the spread widens. RDW does the same thing for your red cells: a low RDW means uniform cells, a high RDW means a mixture of smaller and larger ones.
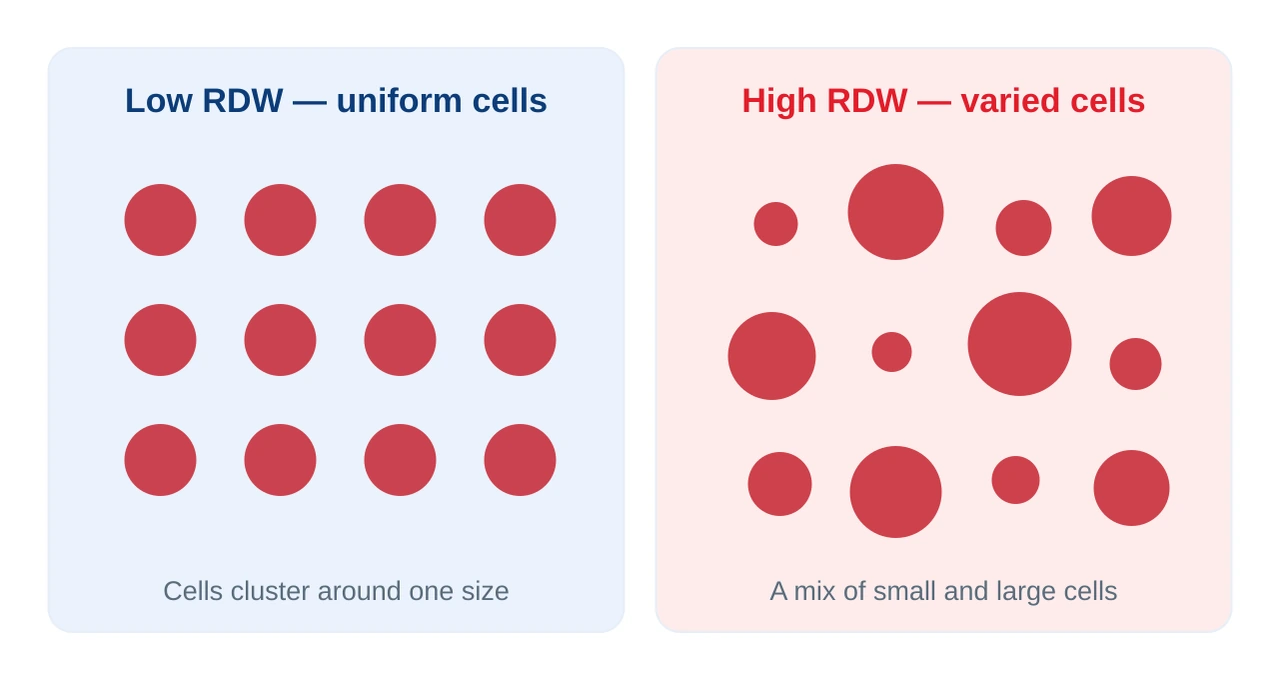
Crucially, RDW says nothing about how many red cells you have or how much haemoglobin they carry. Those jobs belong to the red cell count and the haemoglobin. RDW only describes the variety of sizes. That is exactly why it becomes powerful when combined with the average cell size, the MCV — the two together tell a story that neither can tell alone.
RDW-CV and RDW-SD: two ways to report the same idea
Your report may show RDW in one of two forms, and occasionally both. They describe the same underlying spread of cell sizes, but they are calculated differently.
RDW-CV — the percentage
RDW-CV is a coefficient of variation, expressed as a percentage. It is the most commonly reported form, with a typical adult range of about 11.5–14.5%. Because it is a coefficient of variation, it is calculated relative to the average cell size (the MCV). That makes it convenient, but it also means very small cells can nudge the percentage up even when the absolute spread has not changed much.
RDW-SD — the femtolitre measure
RDW-SD is a standard deviation reported in femtolitres (fL), with a typical range of about 39–46 fL. It measures the actual width of the red-cell size distribution and is less affected by the MCV. Some laboratories favour it because it can pick up a widening spread a little earlier, particularly when the average size is still normal.
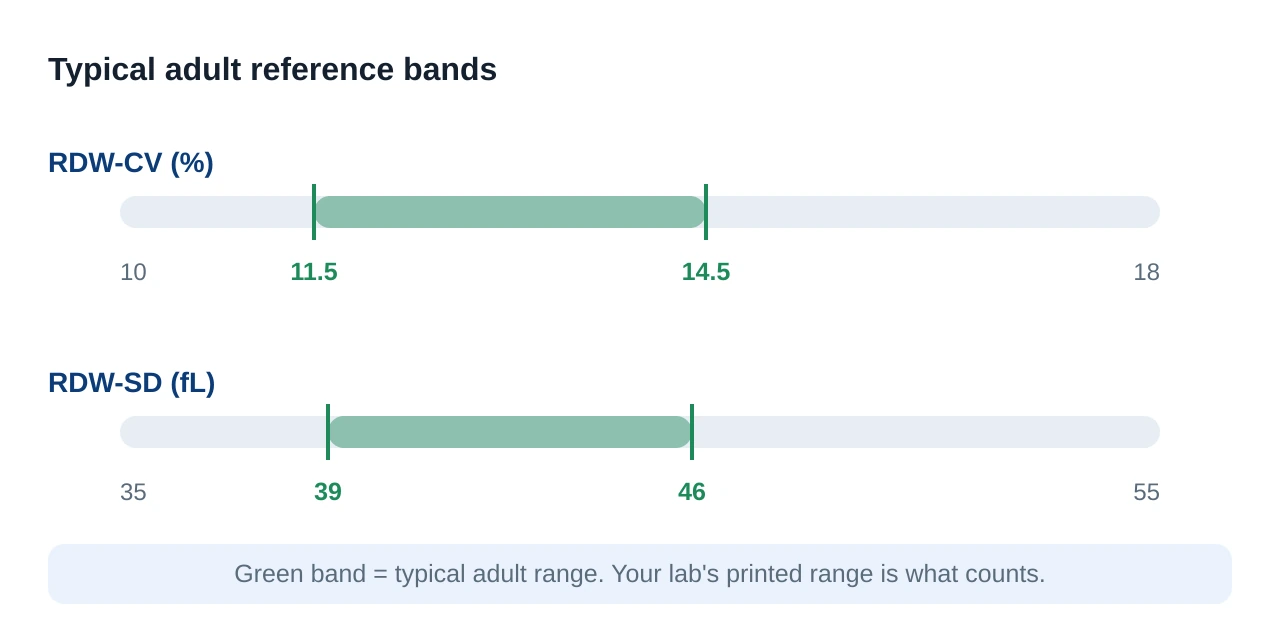
You do not need to memorise which is which. The practical point is simple: whichever form your laboratory uses, compare it against the range printed next to it, and treat a value above that range as a reason to look at the rest of your full blood count — never as a verdict on its own.
Why RDW makes most sense next to your MCV
The MCV (mean corpuscular volume) is the average red-cell size; RDW is the variation around that average. Pairing them is one of the neatest tricks in reading a full blood count, because different problems create different combinations. A useful way to picture this is a simple grid.
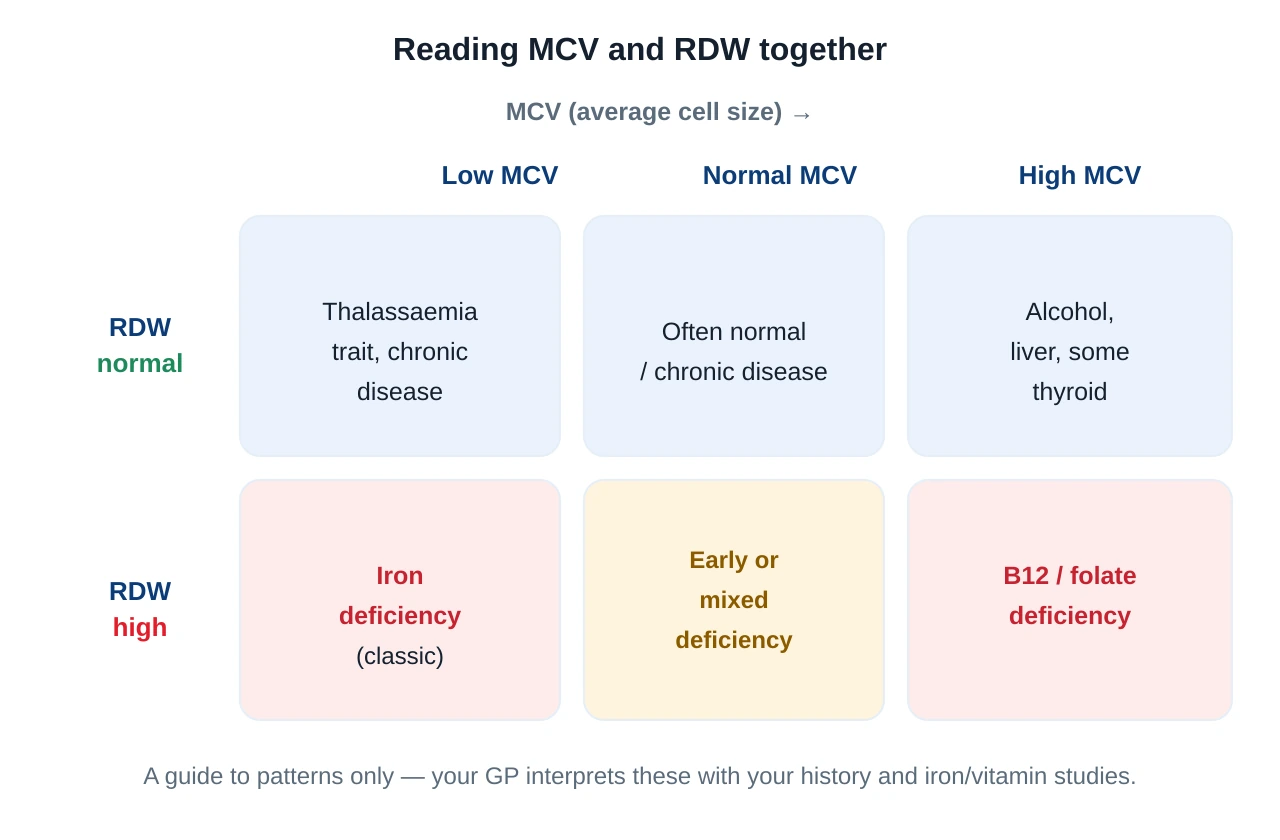
This is where an approach to reading a blood test that looks at patterns, rather than single flags, really pays off. RDW rarely moves in isolation, and the combination it forms with your MCV and haemoglobin is what points towards a cause.
What a high RDW can mean
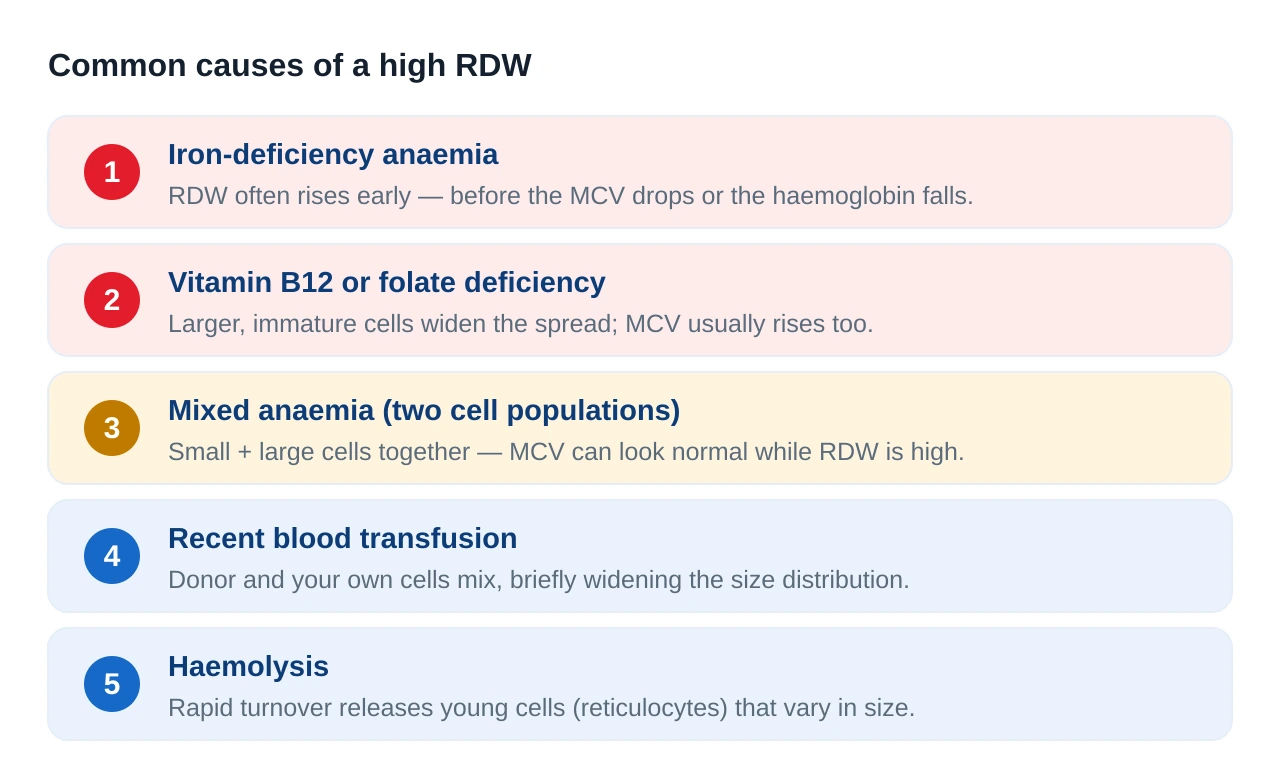
A high RDW tells you that your red cells vary in size more than usual. That happens whenever the bone marrow is producing cells under changing conditions, or when two populations of cells are present at once. The most common explanations are worth knowing.
Iron-deficiency anaemia — RDW rises early
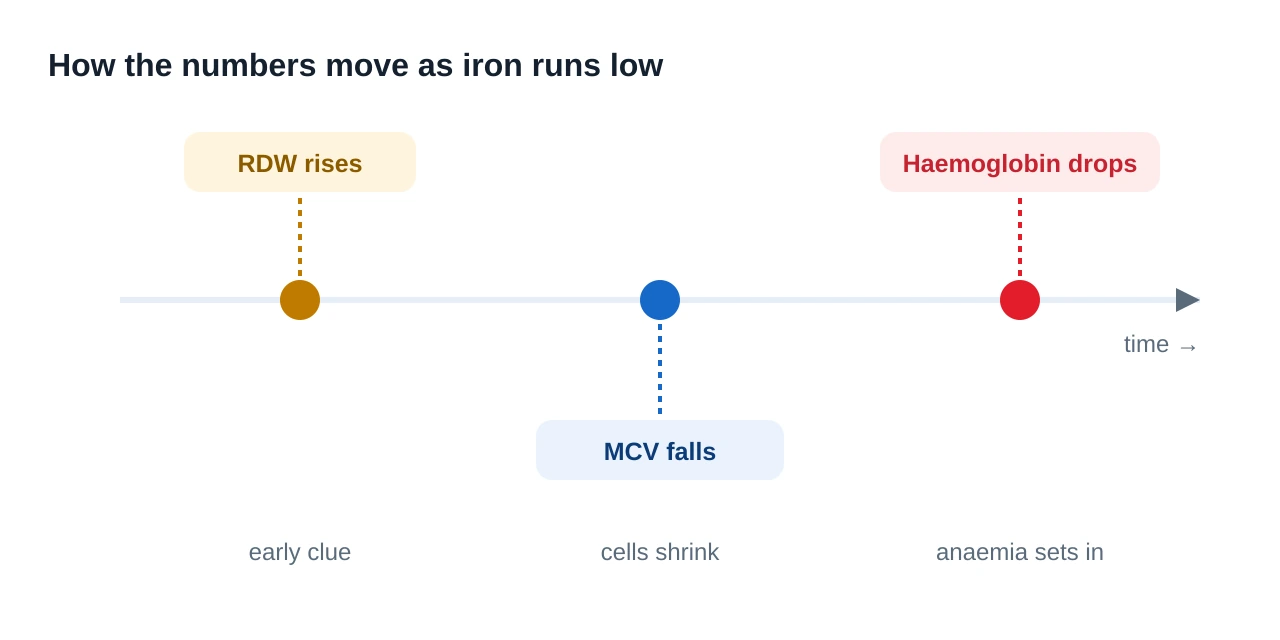
Iron deficiency is the classic cause, and one of RDW's most useful features shows up here: the RDW frequently rises early, before the MCV drops and sometimes before the haemoglobin has fallen below range. As iron stores run down, the marrow starts producing smaller, iron-poor cells while older, normal-sized cells are still in circulation. That mix widens the size distribution and pushes the RDW up. It can be one of the first laboratory hints that iron is running low.
If your RDW is up and iron deficiency is on the cards, the next step is usually a set of iron studies — particularly ferritin. Our companion guide on ferritin and iron studies explains how those results confirm or rule out low iron stores, and why ferritin can be misleading when inflammation is present. If you want a quick read of the pattern before that appointment, you can check your RDW and iron markers together with Kantesti and take the plain-English summary along with you.
Vitamin B12 or folate deficiency
B12 and folate are needed to build red cells properly. When either is low, the marrow releases larger, immature cells. These enlarged cells raise the MCV and, because they sit alongside your existing normal-sized cells, they also widen the spread — so the RDW climbs. A high RDW with a high MCV is a common pattern in B12 or folate deficiency and usually prompts blood tests for both vitamins.
Mixed anaemia — the normal-looking MCV trap
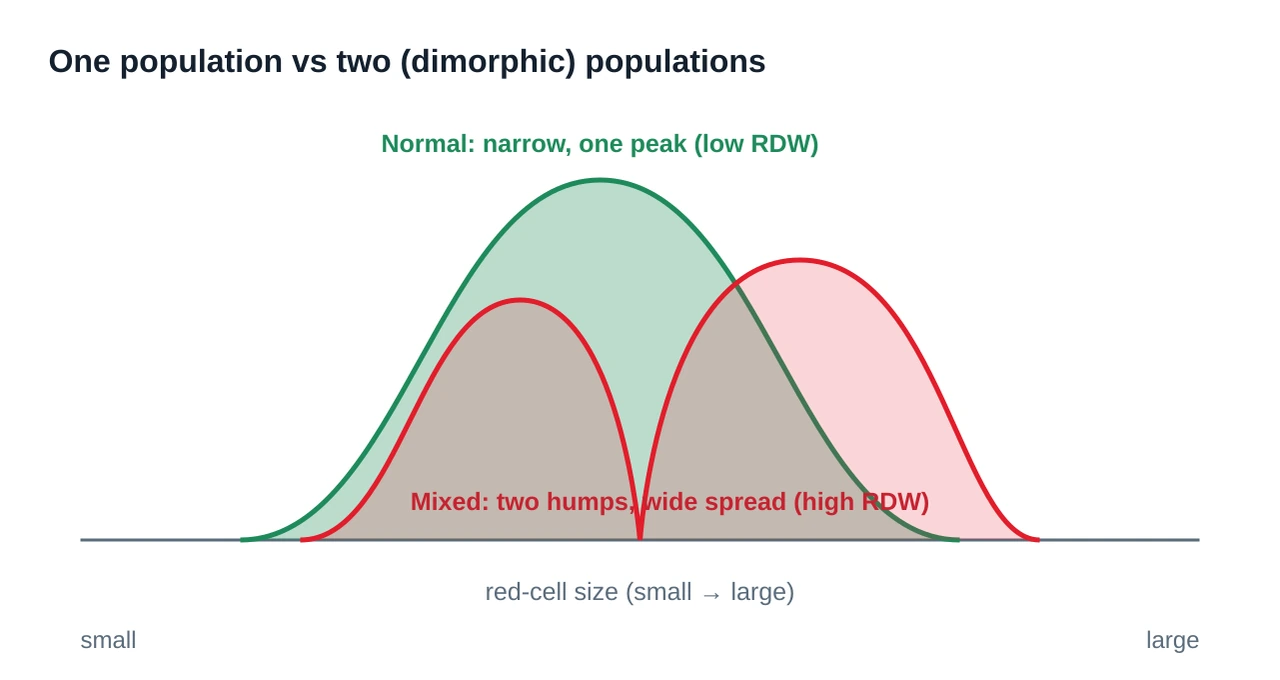
Here is where RDW earns its keep. Imagine someone who is both iron-deficient (which makes cells small) and B12- or folate-deficient (which makes cells large). Averaged together, the MCV can land squarely in the normal range — the small and large cells cancel out. But there are genuinely two populations of cells, so the RDW is high. A normal MCV with a raised RDW is a red flag for exactly this kind of mixed picture, and it is easy to miss if you only glance at the MCV.
Recent transfusion and haemolysis
A recent blood transfusion temporarily mixes donor cells with your own, which naturally widens the size distribution for a while. Haemolysis — the premature breakdown of red cells — speeds up marrow turnover and releases young cells called reticulocytes that vary in size, again pushing the RDW up. In both cases the RDW is doing its job faithfully; the interpretation just depends on the clinical context, which is why your GP considers what has been happening to you, not only the number.
Does a normal RDW rule anything out?
No — and this is an important safety point. A normal RDW does not exclude disease. Some conditions produce anaemia with cells that stay fairly uniform in size, so the RDW can look reassuringly normal even when something is going on. Two familiar examples are thalassaemia trait, which typically gives small but uniform cells, and anaemia of chronic disease, which can sit with a near-normal RDW.
That is why no single value should be read alone. The RDW is a useful pointer, but it belongs inside the wider full blood count. If your haemoglobin is low, your GP will investigate regardless of what the RDW is doing.
Which results to read alongside your RDW
RDW is a supporting actor. To make sense of it, line it up with the markers that share the red-cell story on your full blood count. An AI blood-test analyser can be handy here, because it places all these values side by side and flags the combinations that matter rather than leaving you to cross-reference each one by hand.
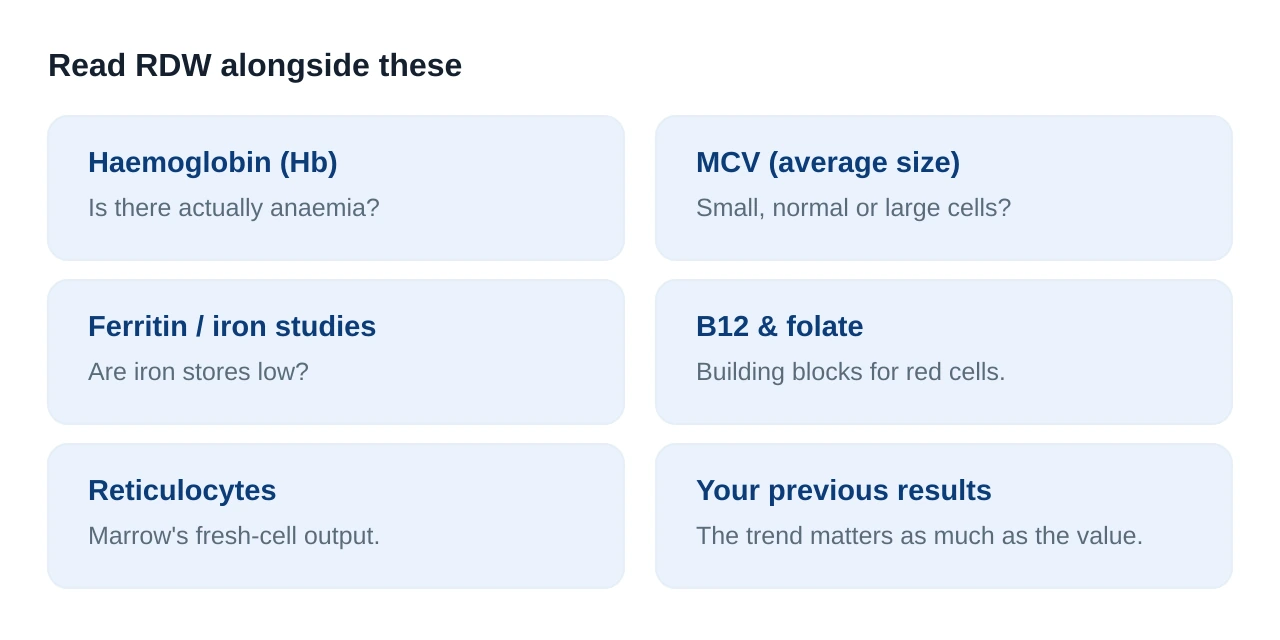
When you paste your numbers into Kantesti, it lines your RDW up against your haemoglobin, MCV and ferritin in a single view and explains each flag in plain English. It will not diagnose you — it does not know your history, medicines or symptoms — but it is a genuinely useful way to prepare focused questions before you speak to your GP. If you would like to see how different tools compare first, our round-up of AI blood-test analysers is a good place to start.
When to speak to your GP
Your full blood count should always be interpreted by the clinician who requested it, because they can see your symptoms and history. That said, some situations warrant a prompt conversation rather than waiting.
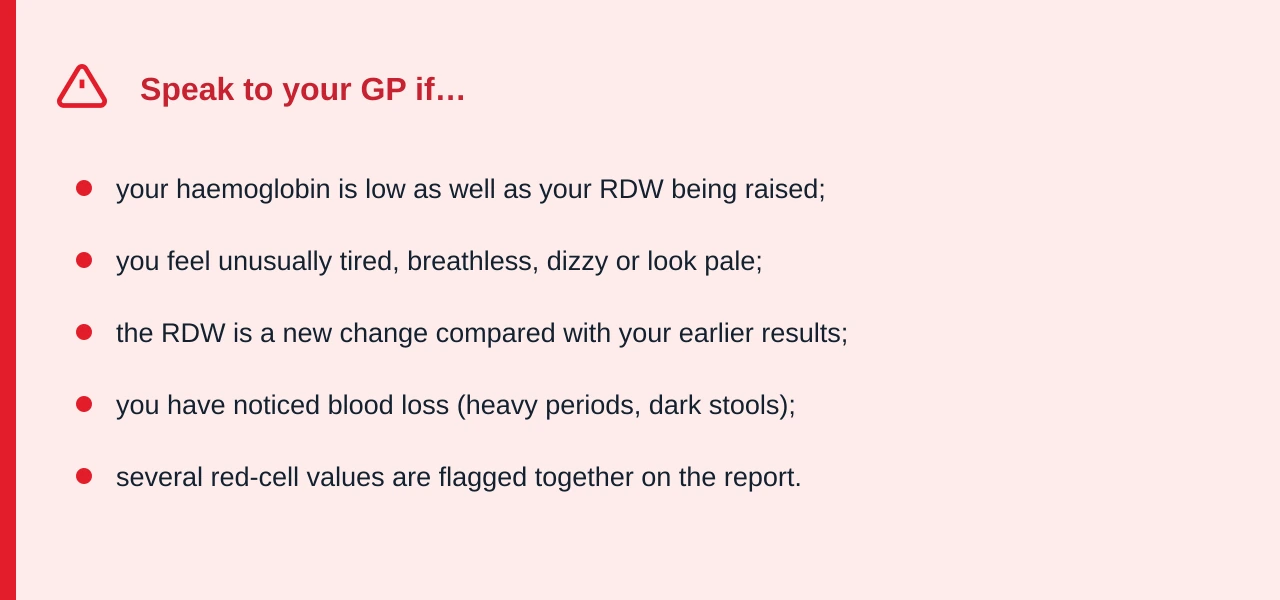
An isolated, mildly raised RDW with a normal haemoglobin and no symptoms is common and frequently harmless. But because it can be the earliest whisper of a developing iron or vitamin deficiency, it is worth flagging at your next appointment so your GP can decide whether iron studies or vitamin levels are needed. If you also want to understand the other numbers on your report, our guides on platelet count and its normal range and on ferritin and iron studies cover the values most often flagged alongside RDW.
See your RDW in the context of your whole blood count
Upload or type in your full blood count and Kantesti lines up your RDW with your haemoglobin, MCV and iron studies, explaining each result in clear, everyday language — perfect preparation for your GP appointment.
Analyse my results with KantestiIn short
RDW measures the variation in your red-cell size — anisocytosis — and appears on every full blood count. RDW-CV (a percentage, typically about 11.5–14.5%) is the form most laboratories report; RDW-SD (in femtolitres, about 39–46 fL) is less affected by the average cell size. A high RDW commonly points to iron-deficiency anaemia (where it rises early), B12 or folate deficiency, a mixed picture with two cell populations, recent transfusion or haemolysis. Its cleverest trick is spotting trouble when the MCV looks normal but the RDW is high. Crucially, a normal RDW does not rule disease out, so always read it together with your haemoglobin and MCV — and let your GP make the call.
Frequently asked questions
What does RDW measure on a blood test?
What is a normal RDW range?
What does a high RDW mean?
Can RDW be high when the MCV is normal?
Does a normal RDW rule out anaemia or deficiency?
Should I worry if only my RDW is flagged high?
Sources & references
- Lab Tests Online UK — Full Blood Count (FBC) — what the FBC measures, including red-cell indices.
- MedlinePlus — Complete Blood Count (CBC) — overview of red-cell parameters and their meaning.
- NICE CKS — Anaemia (iron deficiency) — investigation and interpretation of iron-deficiency anaemia.
- NICE NG8 — Anaemia management (context) — red-cell indices in the broader assessment of anaemia.
- MSD Manual — Iron, ferritin and transferrin saturation values — reference values for follow-up iron studies.